Maybe statistics don't matter as much as we thought? The success of Montador this season shows that, from player to player at even strength, player contribution can be predicted. Special teams, however, are hard to break down.
How much of a role do special teams play in a teams' success? I broke down the numbers based on stats before Monday night's games:

First, that is the points per game average of each team. The teams that would be in the playoffs are hereafter highlighted in green, while those who would miss are highlighted in red.
First up, total special teams percentage:

Four non-playoff teams find themselves in the top half of the chart, but Minnesota and Colorado are pretty close to playoff position. Columbus, Dallas and St. Louis find themselves towards the bottom of the chart despite having pretty high point per game totals.
Next, let's break it down and look at powerplay percentage:
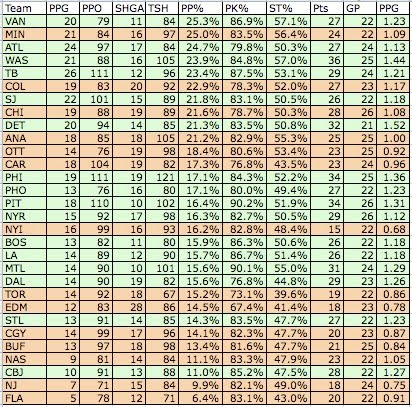
Here we have six non-playoff teams in the top half, with some familiar faces. Minnesota, Colorado, Ottawa and Anaheim find their way over from the previous chart.
Now, shorthanded:

This looks pretty wicked accurate. There is a lot of green stuck at the top of the chart.
However, even more accurate than penalty killing percentage in determining a team's rank...
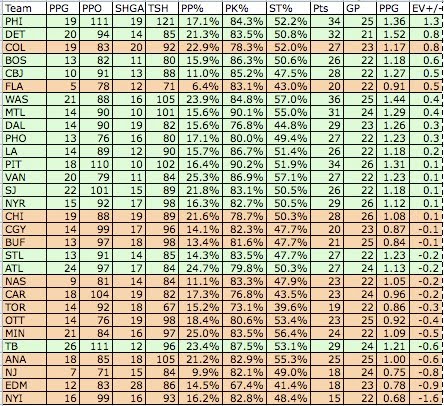
That's your even strength +/- data, collected from Behind The Net. Colorado, who are, again, a fraction of a point out of a playoff spot, are high up, as are Florida, a bit of a statistical anomaly.
If you weight the numbers, you'll find that 5-on-5 play matters a touch more than special teams. I sorted the teams by rank in each statistic, multiplied the 1st place teams' points per game by 30, 2nd place by 29, all the way to the 30th team, I got these numbers:
EV: 551
PK: 543
ST: 540
PP: 535
If you take the points per game of the top 15 teams in each statistical category, you get the following:
EV: 1.24
PK: 1.23
ST: 1.21
PP: 1.19
They are all weighted exceptionally evenly. Obviously, teams that rank low in each category like the Leafs or Oilers are going to have pretty poor point totals, but maybe teams that are getting high point totals despite low special teams or even strength ranks could see their bubble burst. Dallas, who are 9th at even strength but in the lower third of the league in both special teams categories, could be caught--a lot can happen in the West.
We're only at the quarter mark of the season, but this chart may be worth revisiting at the half-way point to see what a larger sample size of games and special teams opportunities can do.
Back to the original point: Buffalo are competent on even-strength, but need to step up. Ryan Miller is 26th in EV SV% after finishing 5th among qualified leaders last season and there's a chance that he'll improve on that, as well as the team improving on their hilariously-low 7% shooting percentage. It's nice to see puck possession statistics pay dividends when good players statistically are given more minutes.
UPDATE: PPP looked into this earlier this month.
No comments:
Post a Comment